

Medical technology company Teleflex (NYSE:TFX) met Wall Street’s revenue expectations in Q1 CY2025, but sales fell by 5% year on year to $700.7 million. Its non-GAAP profit of $2.91 per share was 0.9% above analysts’ consensus estimates.
Is now the time to buy Teleflex? Find out by accessing our full research report, it’s free.
Teleflex (TFX) Q1 CY2025 Highlights:
- Revenue: $700.7 million vs analyst estimates of $699 million (5% year-on-year decline, in line)
- Adjusted EPS: $2.91 vs analyst estimates of $2.88 (0.9% beat)
- Adjusted EPS guidance for the full year is $13.40 at the midpoint, missing analyst estimates by 4.9%
- Operating Margin: 0%, in line with the same quarter last year
- Free Cash Flow Margin: 6.2%, down from 10.1% in the same quarter last year
- Constant Currency Revenue fell 3.8% year on year (3.8% in the same quarter last year)
- Market Capitalization: $6.12 billion
Company Overview
With a portfolio spanning from vascular access catheters to minimally invasive surgical tools, Teleflex (NYSE:TFX) designs, manufactures, and supplies single-use medical devices used in critical care and surgical procedures across hospitals worldwide.
Sales Growth
A company’s long-term sales performance can indicate its overall quality. Any business can put up a good quarter or two, but the best consistently grow over the long haul. Over the last five years, Teleflex grew its sales at a tepid 3% compounded annual growth rate. This fell short of our benchmarks and is a poor baseline for our analysis.
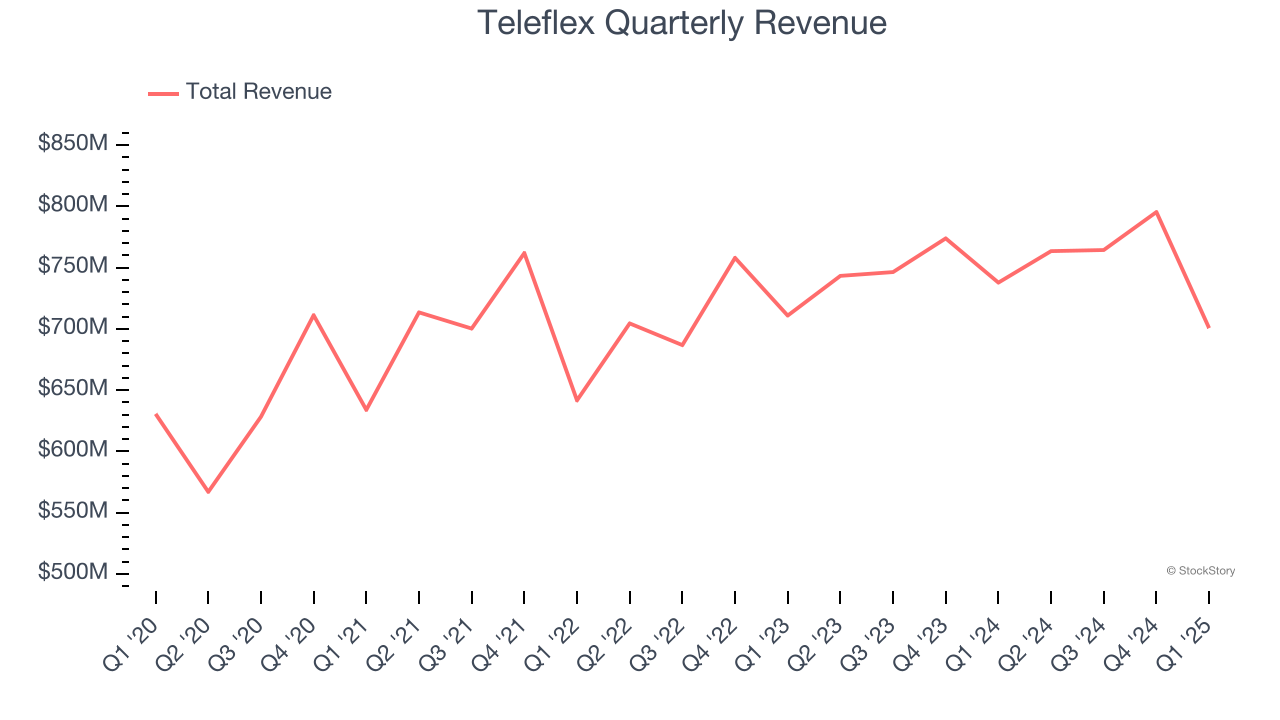
We at StockStory place the most emphasis on long-term growth, but within healthcare, a half-decade historical view may miss recent innovations or disruptive industry trends. Teleflex’s annualized revenue growth of 2.8% over the last two years aligns with its five-year trend, suggesting its demand was consistently weak. 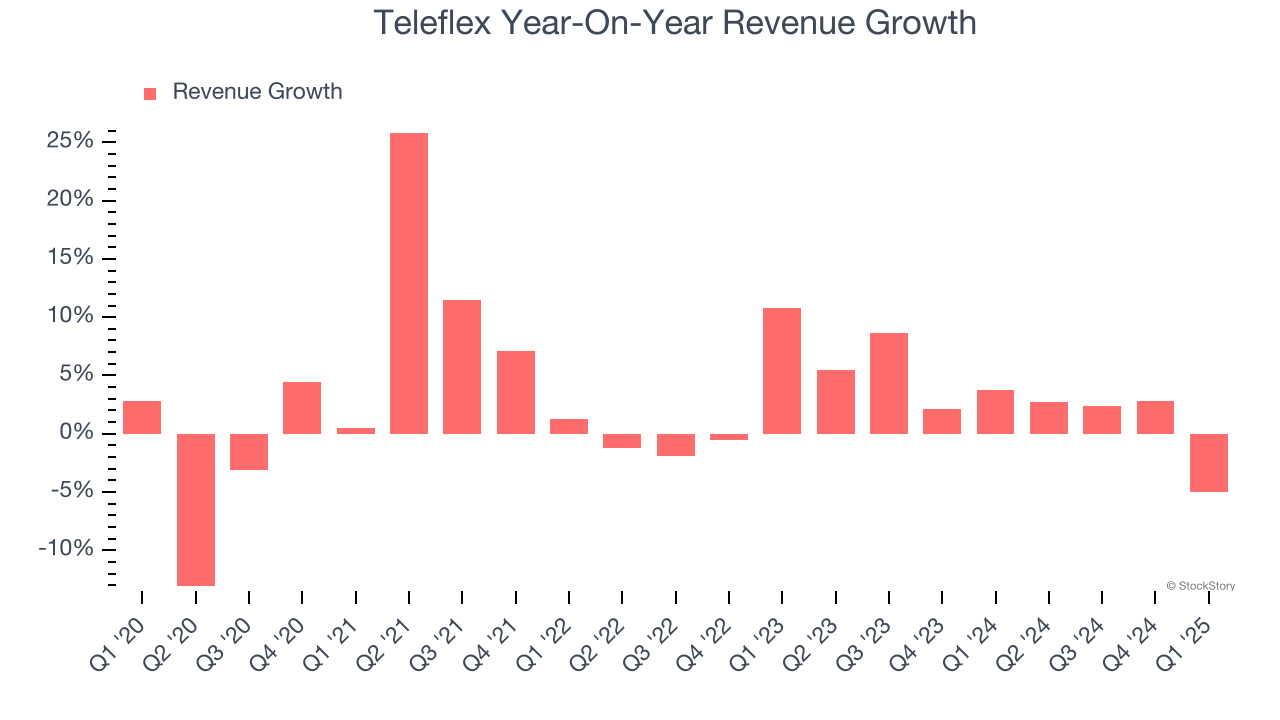
We can dig further into the company’s sales dynamics by analyzing its constant currency revenue, which excludes currency movements that are outside their control and not indicative of demand. Over the last two years, its constant currency sales averaged 2.6% year-on-year growth. Because this number aligns with its normal revenue growth, we can see that Teleflex has properly hedged its foreign currency exposure. 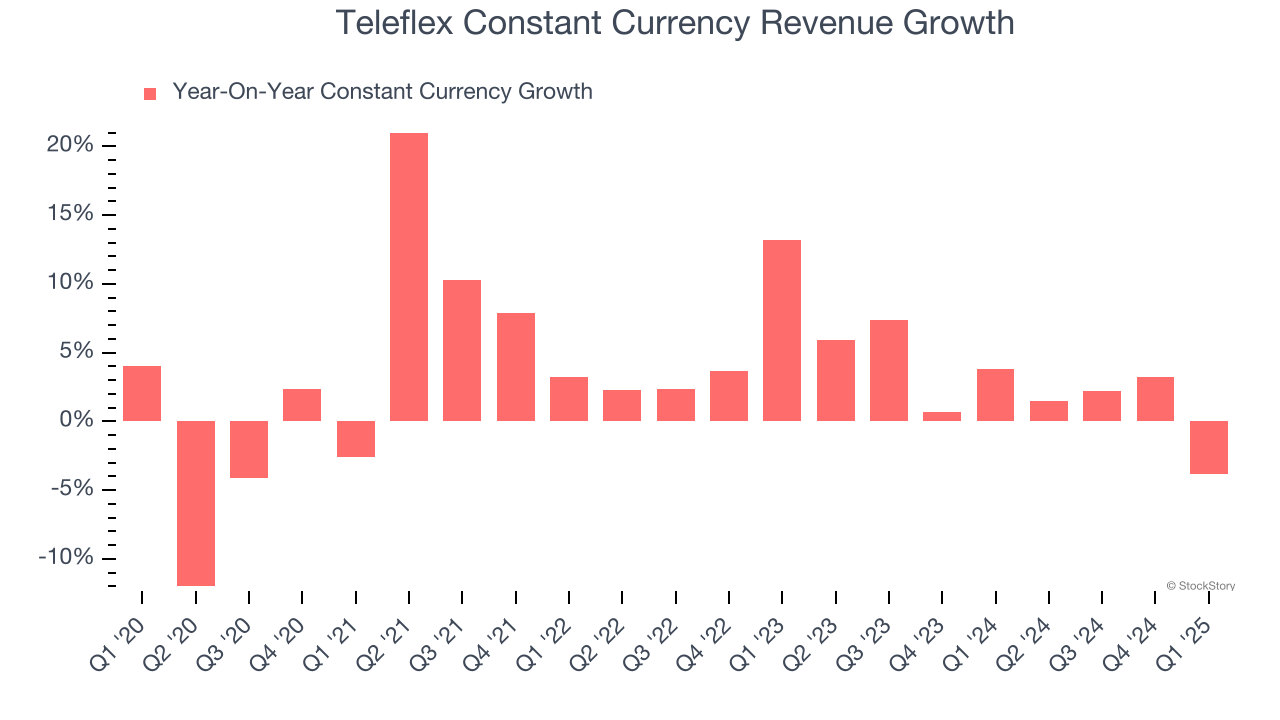
This quarter, Teleflex reported a rather uninspiring 5% year-on-year revenue decline to $700.7 million of revenue, in line with Wall Street’s estimates.
Looking ahead, sell-side analysts expect revenue to grow 2% over the next 12 months, similar to its two-year rate. This projection doesn't excite us and indicates its newer products and services will not accelerate its top-line performance yet.
Software is eating the world and there is virtually no industry left that has been untouched by it. That drives increasing demand for tools helping software developers do their jobs, whether it be monitoring critical cloud infrastructure, integrating audio and video functionality, or ensuring smooth content streaming. Click here to access a free report on our 3 favorite stocks to play this generational megatrend.
Operating Margin
Operating margin is a key measure of profitability. Think of it as net income - the bottom line - excluding the impact of taxes and interest on debt, which are less connected to business fundamentals.
Teleflex has done a decent job managing its cost base over the last five years. The company has produced an average operating margin of 14.4%, higher than the broader healthcare sector.
Looking at the trend in its profitability, Teleflex’s operating margin decreased by 9.4 percentage points over the last five years. This performance was caused by more recent speed bumps as the company’s margin fell by 12.7 percentage points on a two-year basis. We’re disappointed in these results because it shows its expenses were rising and it couldn’t pass those costs onto its customers.
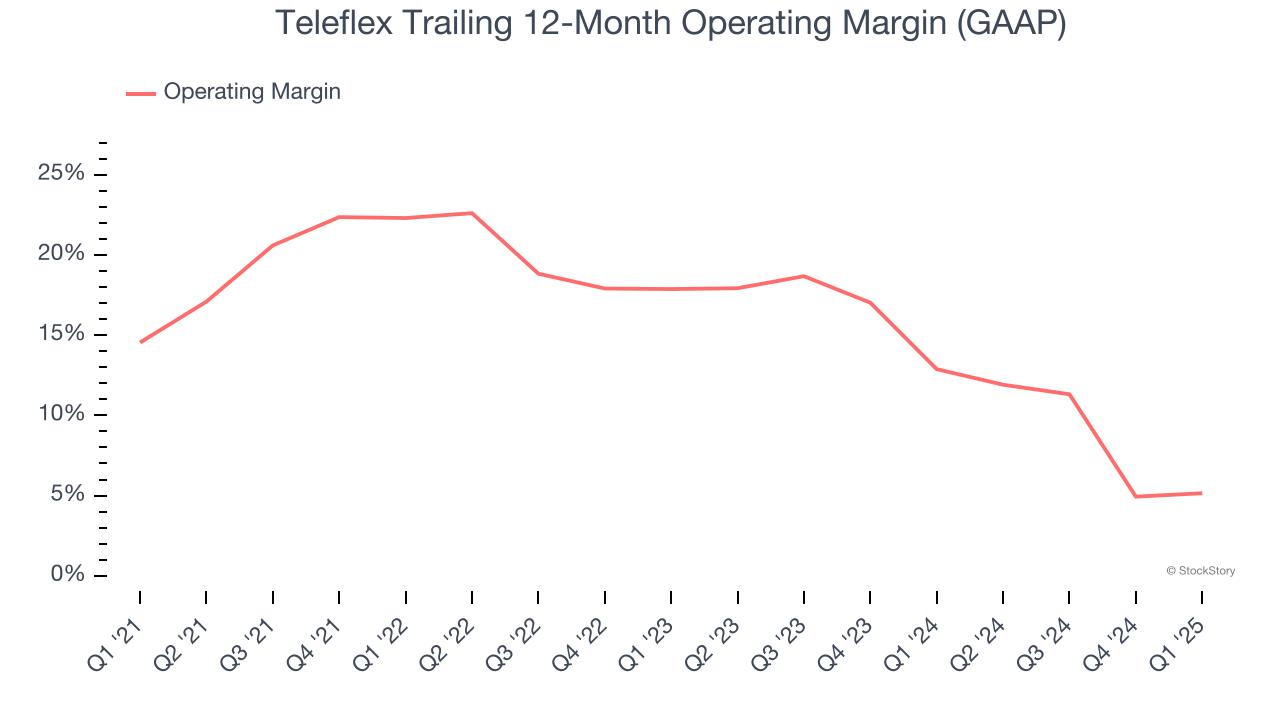
In Q1, Teleflex’s breakeven margin was in line with the same quarter last year. This indicates the company’s overall cost structure has been relatively stable.
Earnings Per Share
Revenue trends explain a company’s historical growth, but the long-term change in earnings per share (EPS) points to the profitability of that growth – for example, a company could inflate its sales through excessive spending on advertising and promotions.
Teleflex’s unimpressive 3.3% annual EPS growth over the last five years aligns with its revenue performance. This tells us it maintained its per-share profitability as it expanded.
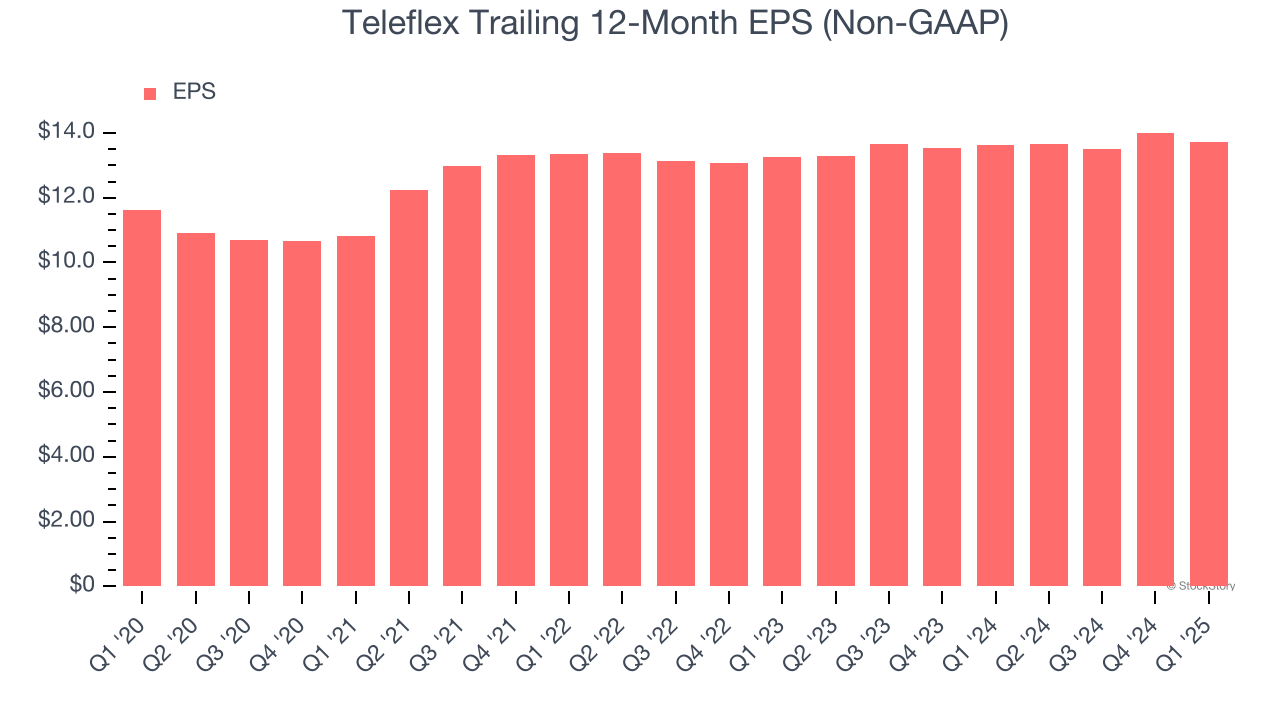
In Q1, Teleflex reported EPS at $2.91, down from $3.21 in the same quarter last year. This print was close to analysts’ estimates. Over the next 12 months, Wall Street expects Teleflex’s full-year EPS of $13.71 to grow 6.3%.
Key Takeaways from Teleflex’s Q1 Results
We struggled to find many positives in these results. Its full-year EPS guidance missed significantly and its constant currency revenue was in line with Wall Street’s estimates. Overall, this was a softer quarter. The stock traded down 4.8% to $130.32 immediately after reporting.
Teleflex’s earnings report left more to be desired. Let’s look forward to see if this quarter has created an opportunity to buy the stock. When making that decision, it’s important to consider its valuation, business qualities, as well as what has happened in the latest quarter. We cover that in our actionable full research report which you can read here, it’s free.