

Heating, ventilation, air conditioning, and refrigeration company Carrier Global (NYSE:CARR) met Wall Street’s revenue expectations in Q1 CY2025, but sales fell by 3.7% year on year to $5.22 billion. The company’s full-year revenue guidance of $23 billion at the midpoint came in 1.5% above analysts’ estimates. Its non-GAAP profit of $0.65 per share was 11.3% above analysts’ consensus estimates.
Is now the time to buy Carrier Global? Find out by accessing our full research report, it’s free.
Carrier Global (CARR) Q1 CY2025 Highlights:
- Revenue: $5.22 billion vs analyst estimates of $5.2 billion (3.7% year-on-year decline, in line)
- Adjusted EPS: $0.65 vs analyst estimates of $0.58 (11.3% beat)
- Adjusted EBITDA: $955 million vs analyst estimates of $1.06 billion (18.3% margin, 10.2% miss)
- The company lifted its revenue guidance for the full year to $23 billion at the midpoint from $22.75 billion, a 1.1% increase
- Management raised its full-year Adjusted EPS guidance to $3.05 at the midpoint, a 1.7% increase
- Operating Margin: 12.1%, up from 7.1% in the same quarter last year
- Free Cash Flow was $420 million, up from -$64 million in the same quarter last year
- Organic Revenue rose 2% year on year, in line with the same quarter last year
- Market Capitalization: $54.03 billion
"We delivered another quarter of strong financial performance," said Carrier Chairman & CEO David Gitlin.
Company Overview
Founded by the inventor of air conditioning, Carrier Global (NYSE:CARR) manufactures heating, ventilation, air conditioning, and refrigeration products.
Sales Growth
A company’s long-term performance is an indicator of its overall quality. Any business can put up a good quarter or two, but the best consistently grow over the long haul. Over the last five years, Carrier Global grew its sales at a sluggish 4.2% compounded annual growth rate. This fell short of our benchmark for the industrials sector and is a poor baseline for our analysis.
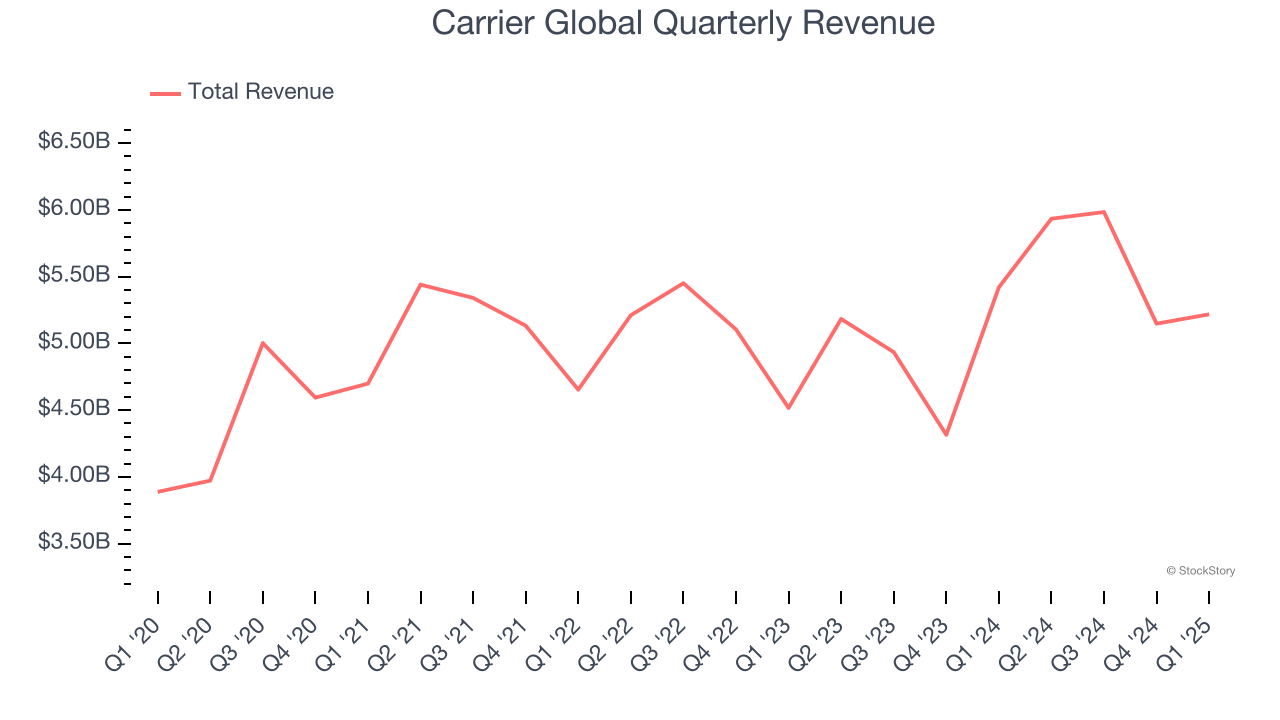
Long-term growth is the most important, but within industrials, a half-decade historical view may miss new industry trends or demand cycles. Carrier Global’s annualized revenue growth of 4.8% over the last two years aligns with its five-year trend, suggesting its demand was consistently weak. 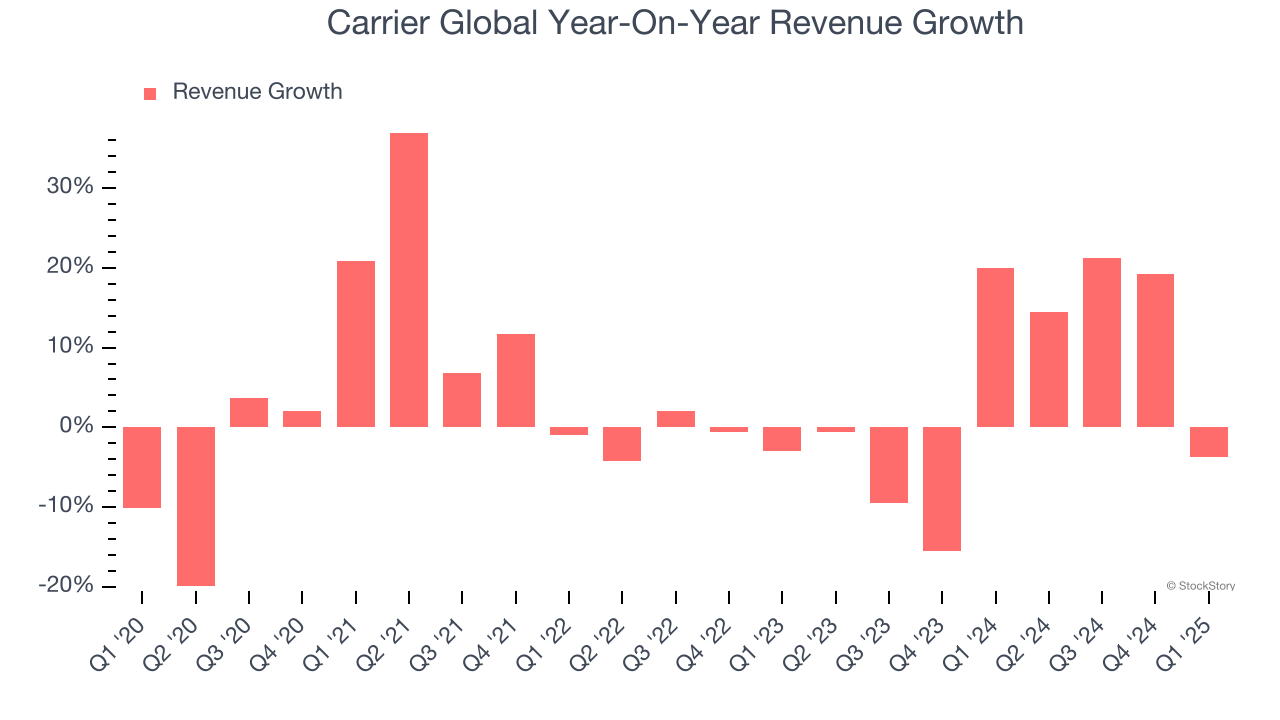
We can dig further into the company’s sales dynamics by analyzing its organic revenue, which strips out one-time events like acquisitions and currency fluctuations that don’t accurately reflect its fundamentals. Over the last two years, Carrier Global’s organic revenue averaged 2.6% year-on-year growth. Because this number is lower than its normal revenue growth, we can see that some mixture of acquisitions and foreign exchange rates boosted its headline results. 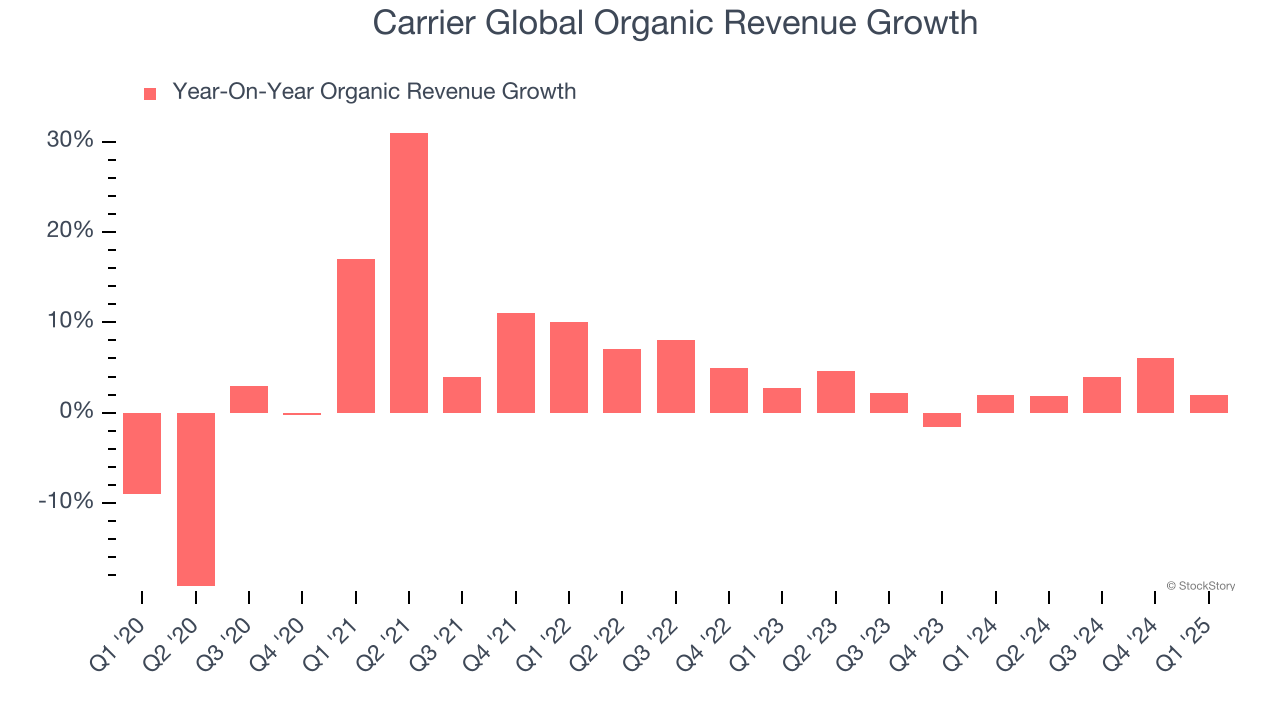
This quarter, Carrier Global reported a rather uninspiring 3.7% year-on-year revenue decline to $5.22 billion of revenue, in line with Wall Street’s estimates.
Looking ahead, sell-side analysts expect revenue to grow 3.2% over the next 12 months, a slight deceleration versus the last two years. This projection doesn't excite us and suggests its products and services will see some demand headwinds.
Unless you’ve been living under a rock, it should be obvious by now that generative AI is going to have a huge impact on how large corporations do business. While Nvidia and AMD are trading close to all-time highs, we prefer a lesser-known (but still profitable) stock benefiting from the rise of AI. Click here to access our free report one of our favorites growth stories.
Operating Margin
Operating margin is one of the best measures of profitability because it tells us how much money a company takes home after procuring and manufacturing its products, marketing and selling those products, and most importantly, keeping them relevant through research and development.
Carrier Global has been an efficient company over the last five years. It was one of the more profitable businesses in the industrials sector, boasting an average operating margin of 15.2%. This result was particularly impressive because of its low gross margin, which is mostly a factor of what it sells and takes huge shifts to move meaningfully. Companies have more control over their operating margins, and it’s a show of well-managed operations if they’re high when gross margins are low.
Looking at the trend in its profitability, Carrier Global’s operating margin decreased by 5.3 percentage points over the last five years. This raises questions about the company’s expense base because its revenue growth should have given it leverage on its fixed costs, resulting in better economies of scale and profitability.
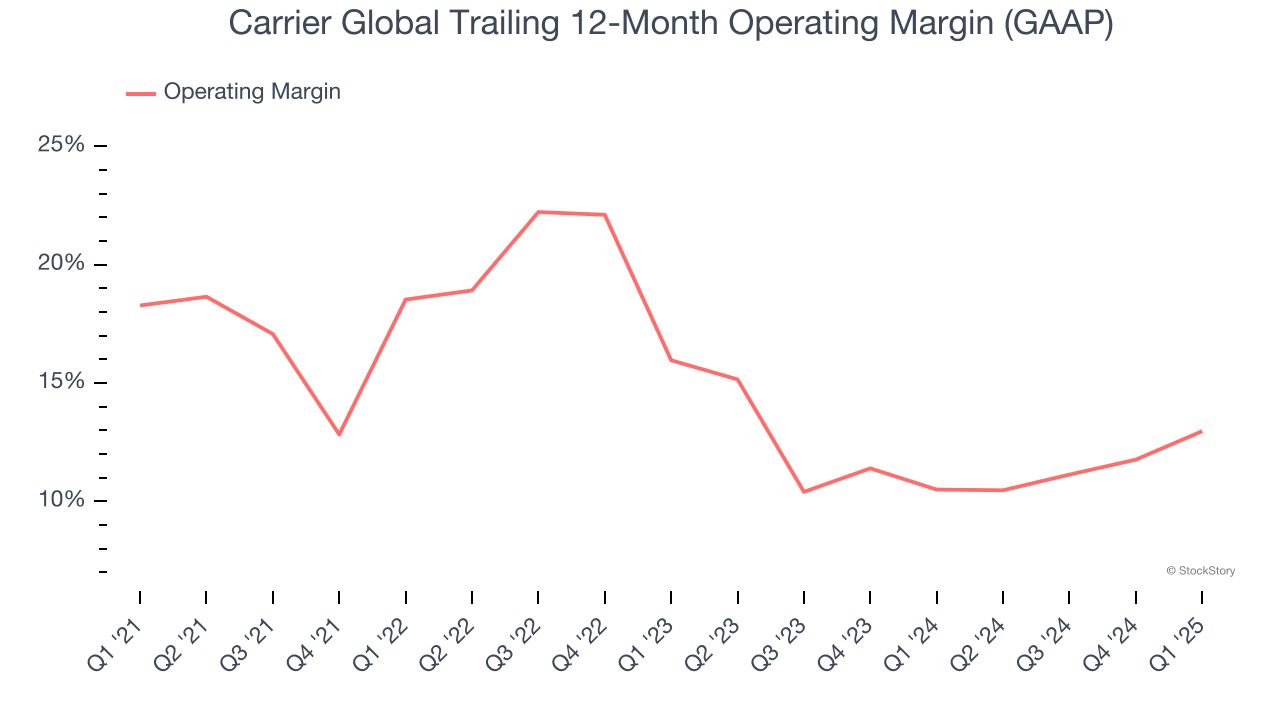
This quarter, Carrier Global generated an operating profit margin of 12.1%, up 5 percentage points year on year. Since its gross margin expanded more than its operating margin, we can infer that leverage on its cost of sales was the primary driver behind the recently higher efficiency.
Earnings Per Share
Revenue trends explain a company’s historical growth, but the long-term change in earnings per share (EPS) points to the profitability of that growth – for example, a company could inflate its sales through excessive spending on advertising and promotions.
Carrier Global’s EPS grew at a weak 2.8% compounded annual growth rate over the last five years, lower than its 4.2% annualized revenue growth. This tells us the company became less profitable on a per-share basis as it expanded.
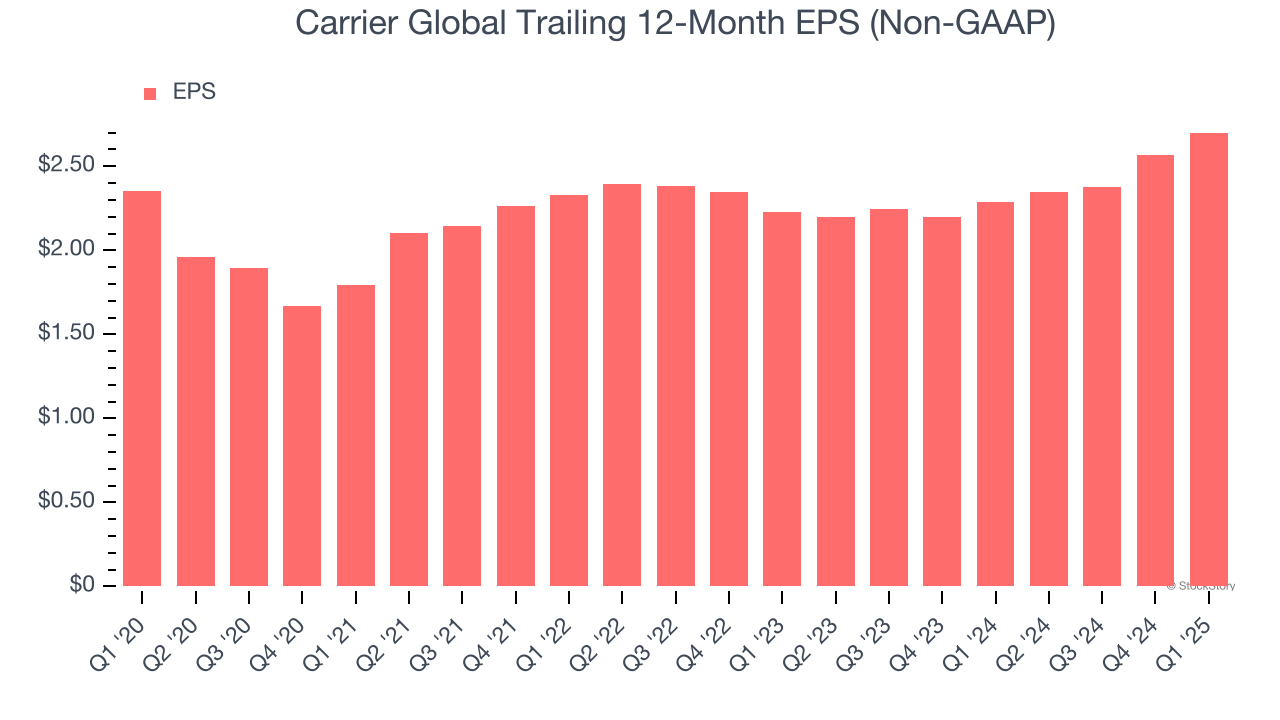
We can take a deeper look into Carrier Global’s earnings to better understand the drivers of its performance. As we mentioned earlier, Carrier Global’s operating margin improved this quarter but declined by 5.3 percentage points over the last five years. Its share count also grew by 1.4%, meaning the company not only became less efficient with its operating expenses but also diluted its shareholders. 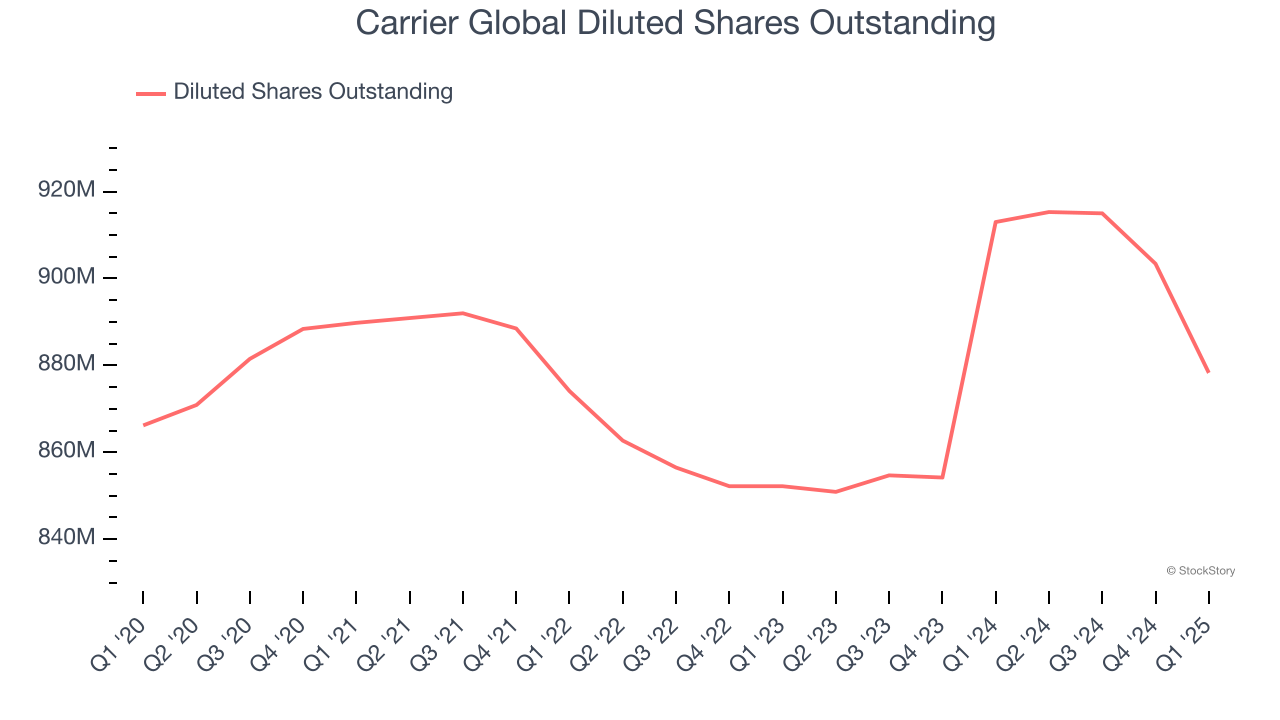
Like with revenue, we analyze EPS over a shorter period to see if we are missing a change in the business.
For Carrier Global, its two-year annual EPS growth of 10.2% was higher than its five-year trend. This acceleration made it one of the faster-growing industrials companies in recent history.
In Q1, Carrier Global reported EPS at $0.65, up from $0.51 in the same quarter last year. This print easily cleared analysts’ estimates, and shareholders should be content with the results. Over the next 12 months, Wall Street expects Carrier Global’s full-year EPS of $2.70 to grow 13.6%.
Key Takeaways from Carrier Global’s Q1 Results
The company beat EPS expectations pretty convincingly this quarter. It was also great to see Carrier Global’s full-year revenue and EPS guidance top analysts’ expectations after being raised. Overall, this quarter had some key positives. The stock traded up 5% to $65.60 immediately after reporting.
Is Carrier Global an attractive investment opportunity right now? If you’re making that decision, you should consider the bigger picture of valuation, business qualities, as well as the latest earnings. We cover that in our actionable full research report which you can read here, it’s free.